Skip links

Case VC fund · United States · 2025

Space as an asset class.

Not long ago, space investing meant patient capital: 12 to 15-year horizons, rare exits and heavy dependence on government programs. Recent years changed that picture. Venture funding peaked in 2025, the number of space unicorns tripled in four years, and public markets opened the widest window for space IPOs since 2021.

A large venture fund with deep SpaceTech expertise brought in Blank to work out where value is concentrating in the new space economy and to turn that view into an industry report under the fund's own brand. We delivered a study of the global market with a focus on US startups: from space agency budgets and the new US policy agenda to the biggest deals of 2025 and profiles of the companies most likely to shape the next decade.

80+Slides in the final report
5Expert interviews
12Segments in the taxonomy
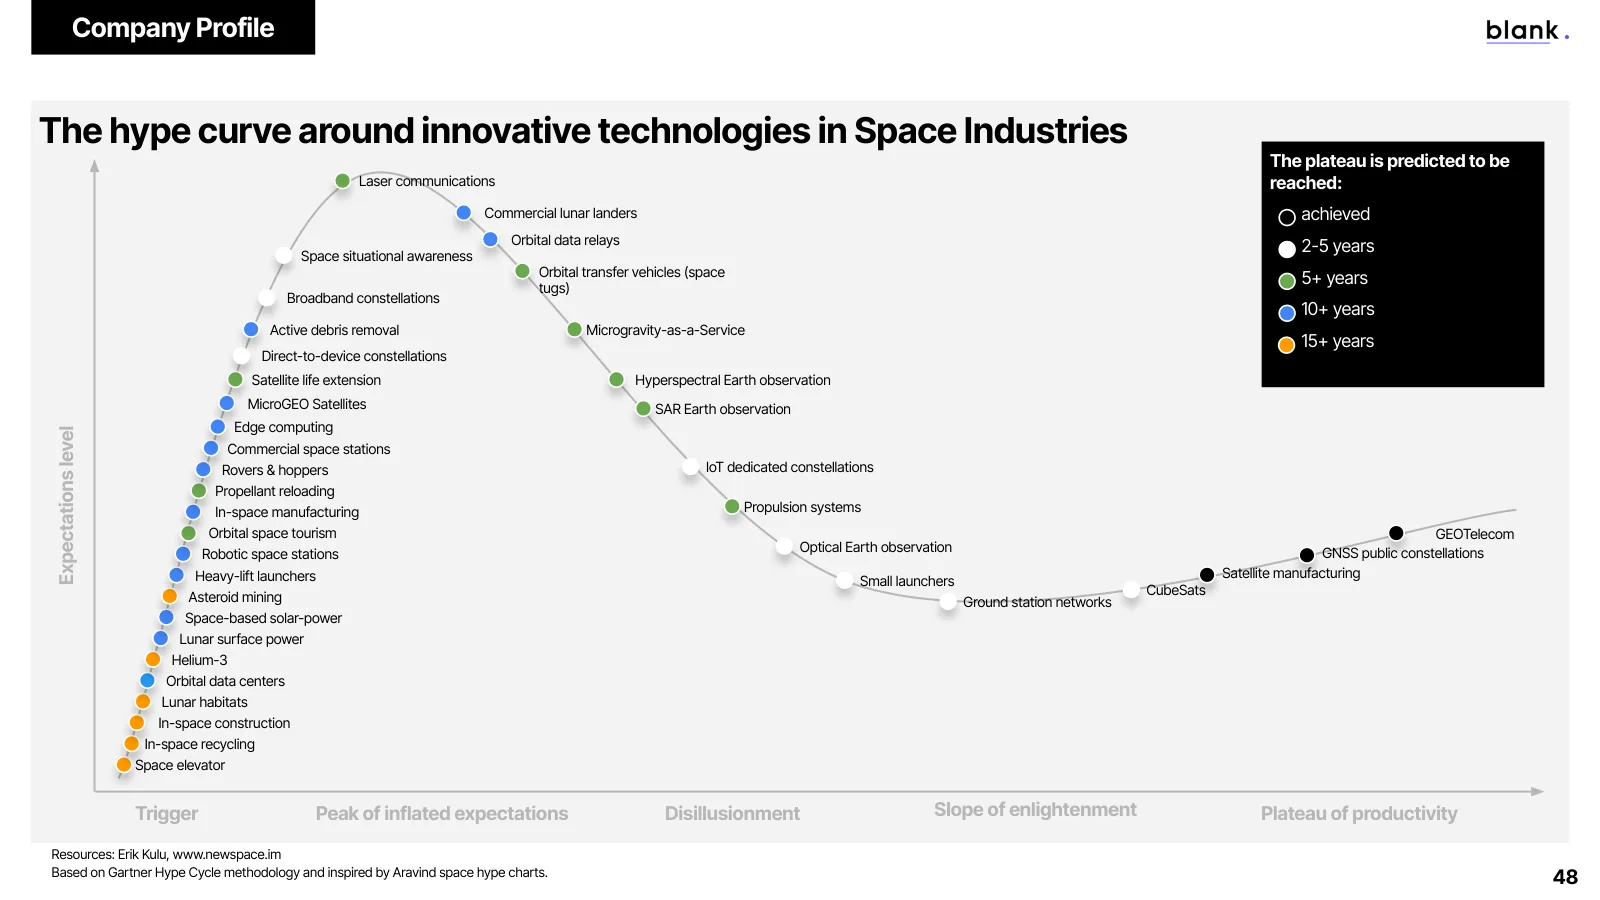
39Technologies on the hype curve
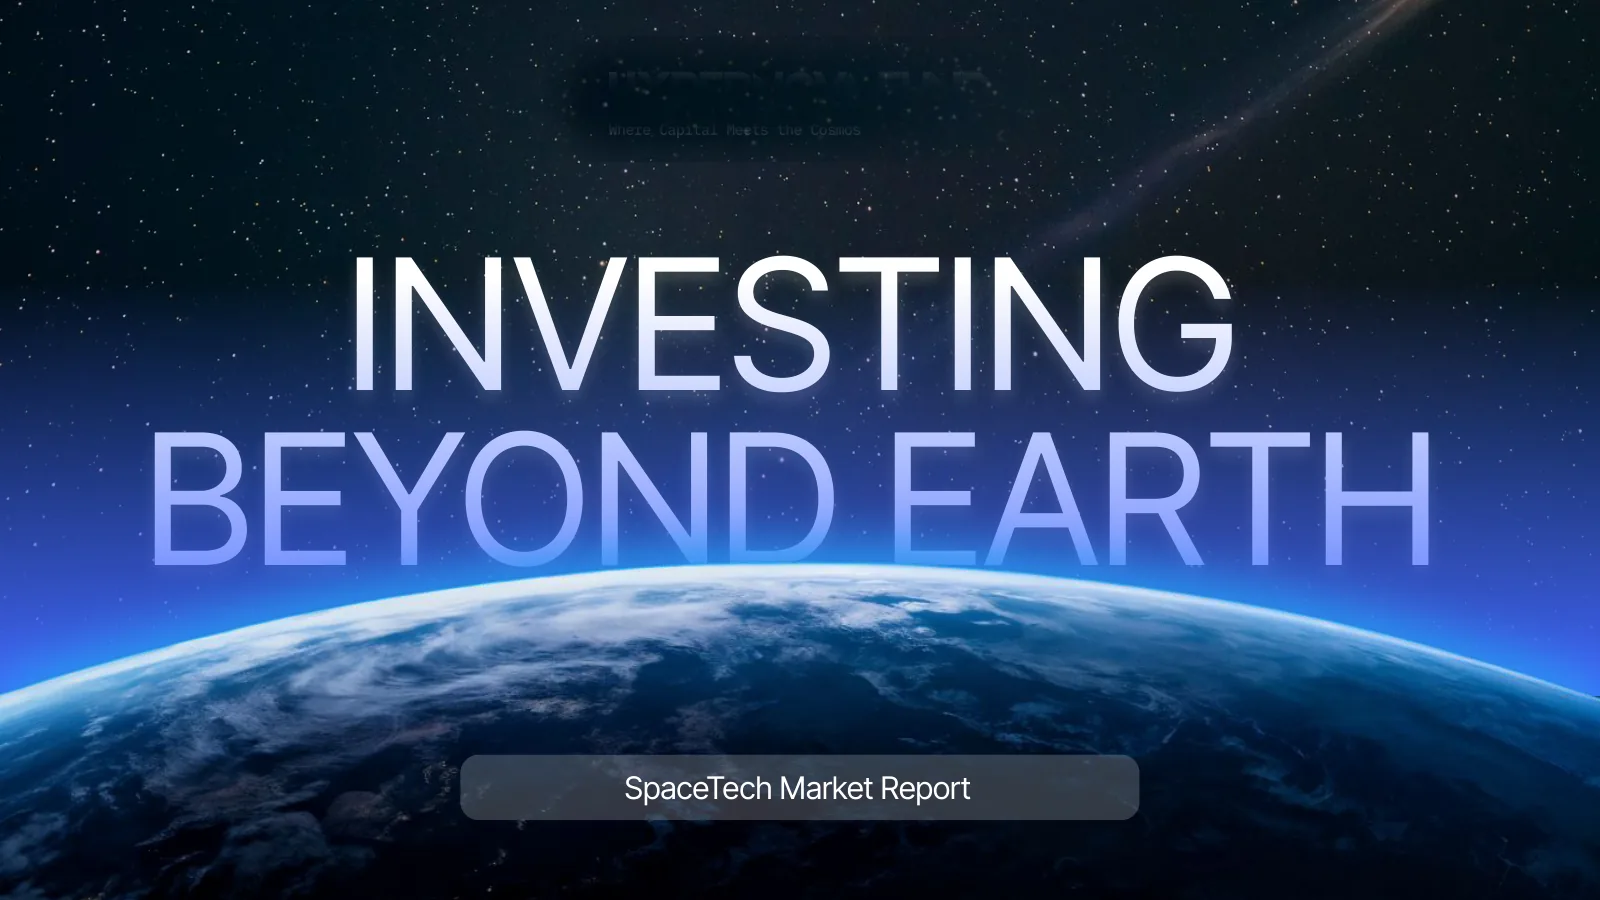
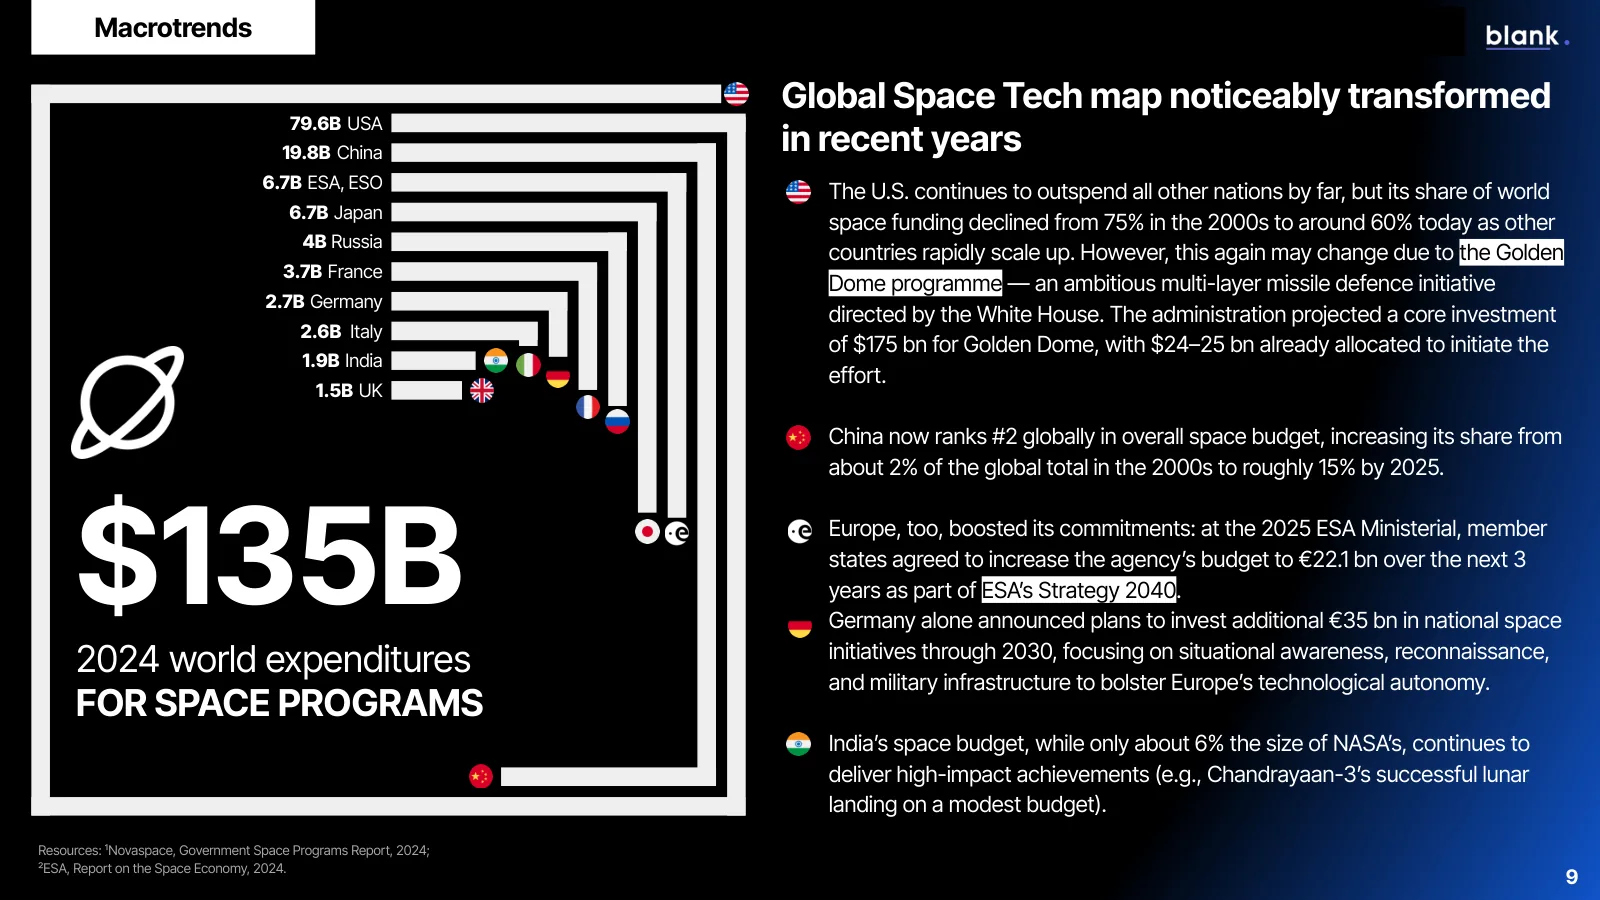
Slide on the $135 billion of world spending on space programs in 2024 Cover of the SpaceTech market report: Investing Beyond Earth

A report the fund could put in front of its LPs.

Our client backs early-stage startups across the US and Europe. Its thesis is built around the foundational layers of the space economy: energy generation for orbital and deep-space use, propulsion, space infrastructure, debris management, space weather monitoring and in-orbit services.

The fund wanted to publish a report under its own brand that would ground its view of the market in data and make it accessible to a broad professional audience: LPs, co-investors, founders and industry partners. A document like this can anchor a conversation with an LP, go out to a co-investor ahead of a syndicated round, or open a first meeting with a founding team.

The fund's team

  • Set the investment lens and the questions the report had to answer
  • Brought in experts from its advisory board
  • Reviewed the drafts and signed off the final deck

Our team

  • Owned the structure and the writing
  • Collected the data from space agencies, venture databases and industry reports
  • Ran the interviews and built the company profiles
  • Designed the 80 slides in the fund's brand

Eight of the 80 slides.

Drag the strip to scroll, click a slide to open it full screen.

Report cover: Investing Beyond Earth01
Cover. Investing Beyond Earth, the SpaceTech market report.
Slide: global space program spending map, $135 billion in 202402
Macrotrends. $135 billion of world spending on space programs in 2024: who pays and for what.
Slide: orbits are reaching capacity, satellite launches by year03
A traffic jam above us. How many satellites are already up there and how fast the number grows.
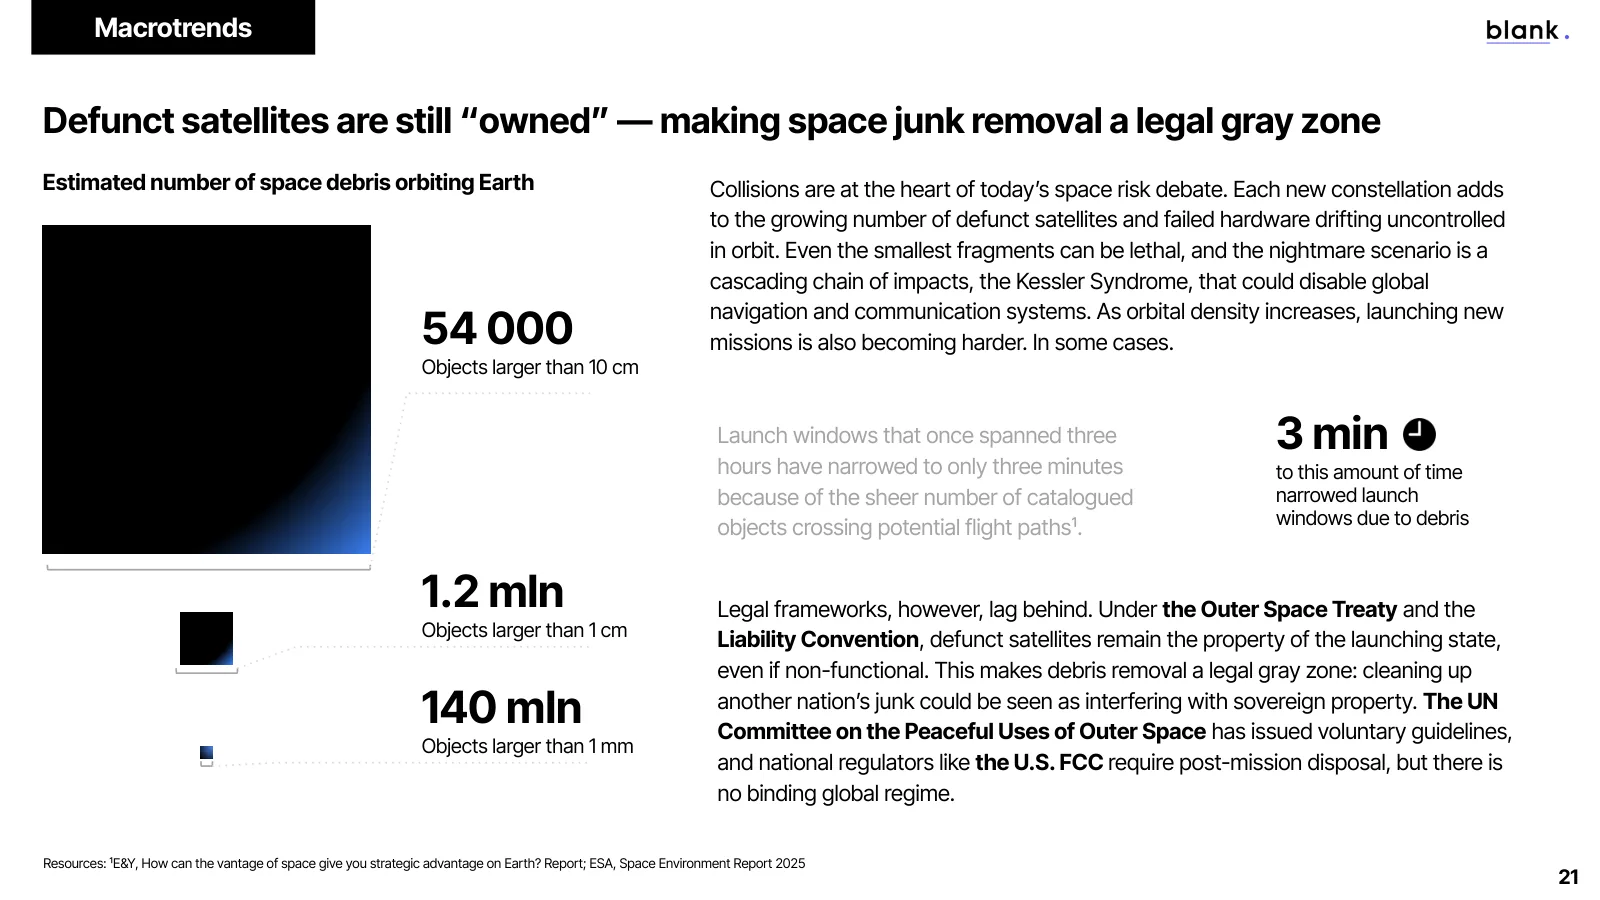
Slide: defunct satellites remain owned, space junk removal is a legal gray zone04
The legal gray zone. A dead satellite still belongs to the launching state, which complicates debris removal.
Slide: the biggest wave of Space Tech IPOs since 202105
Investment pulse. The biggest wave of space IPOs since 2021 and J.P. Morgan's $1.5 trillion initiative.
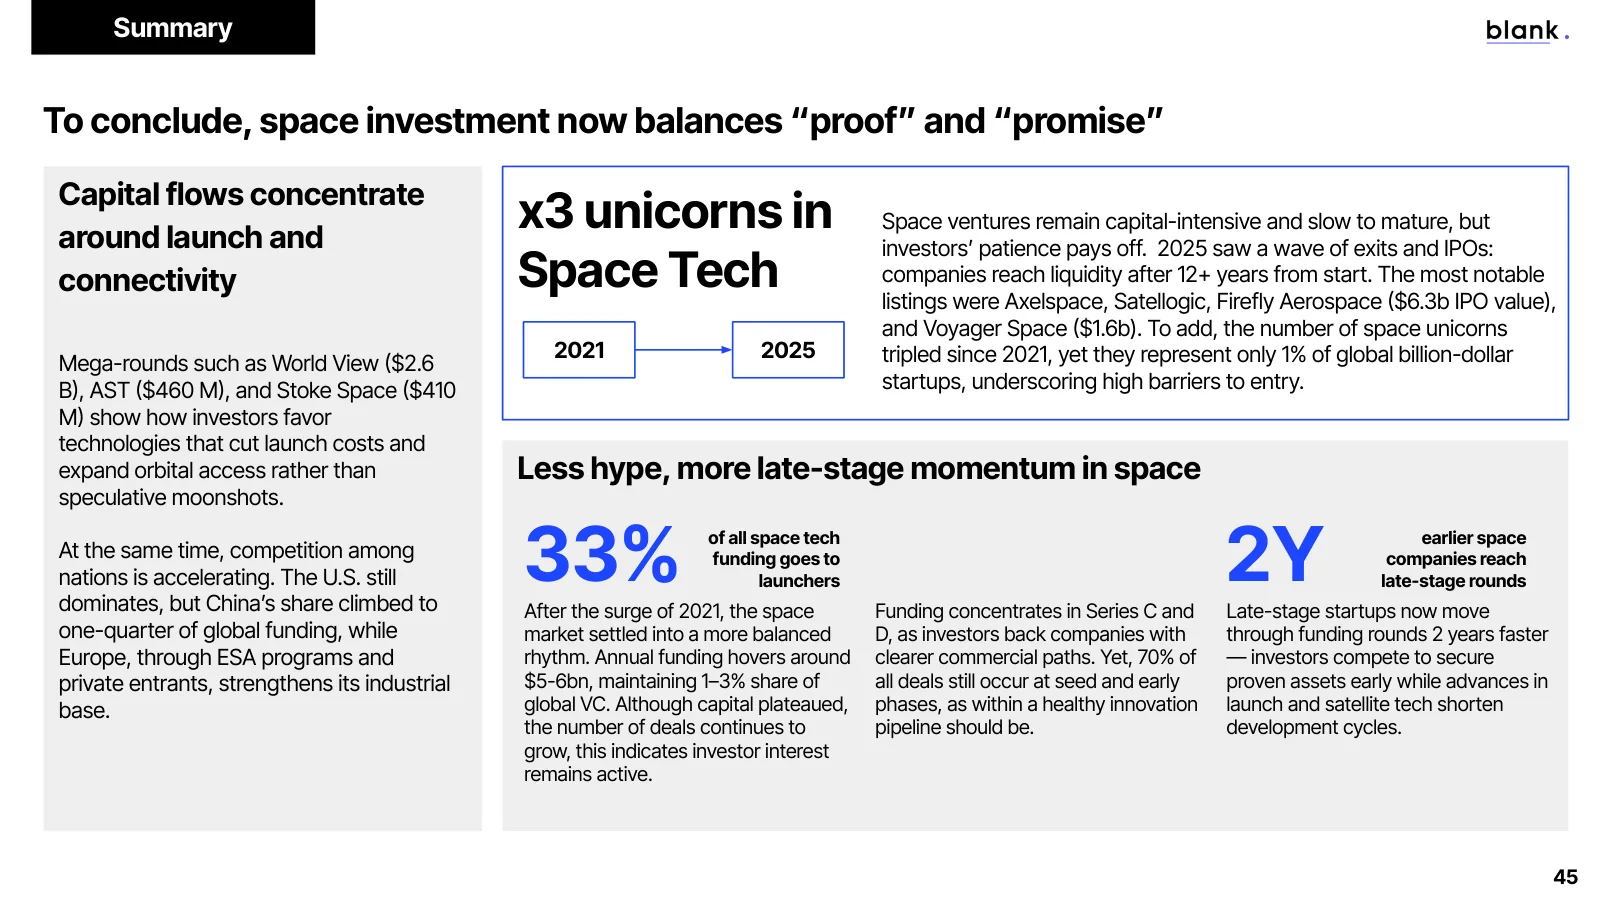
Slide: space investment balances proof and promise, summary of the investment chapter06
Chapter summary. Space investment now balances proof and promise: three unicorns became fifteen.
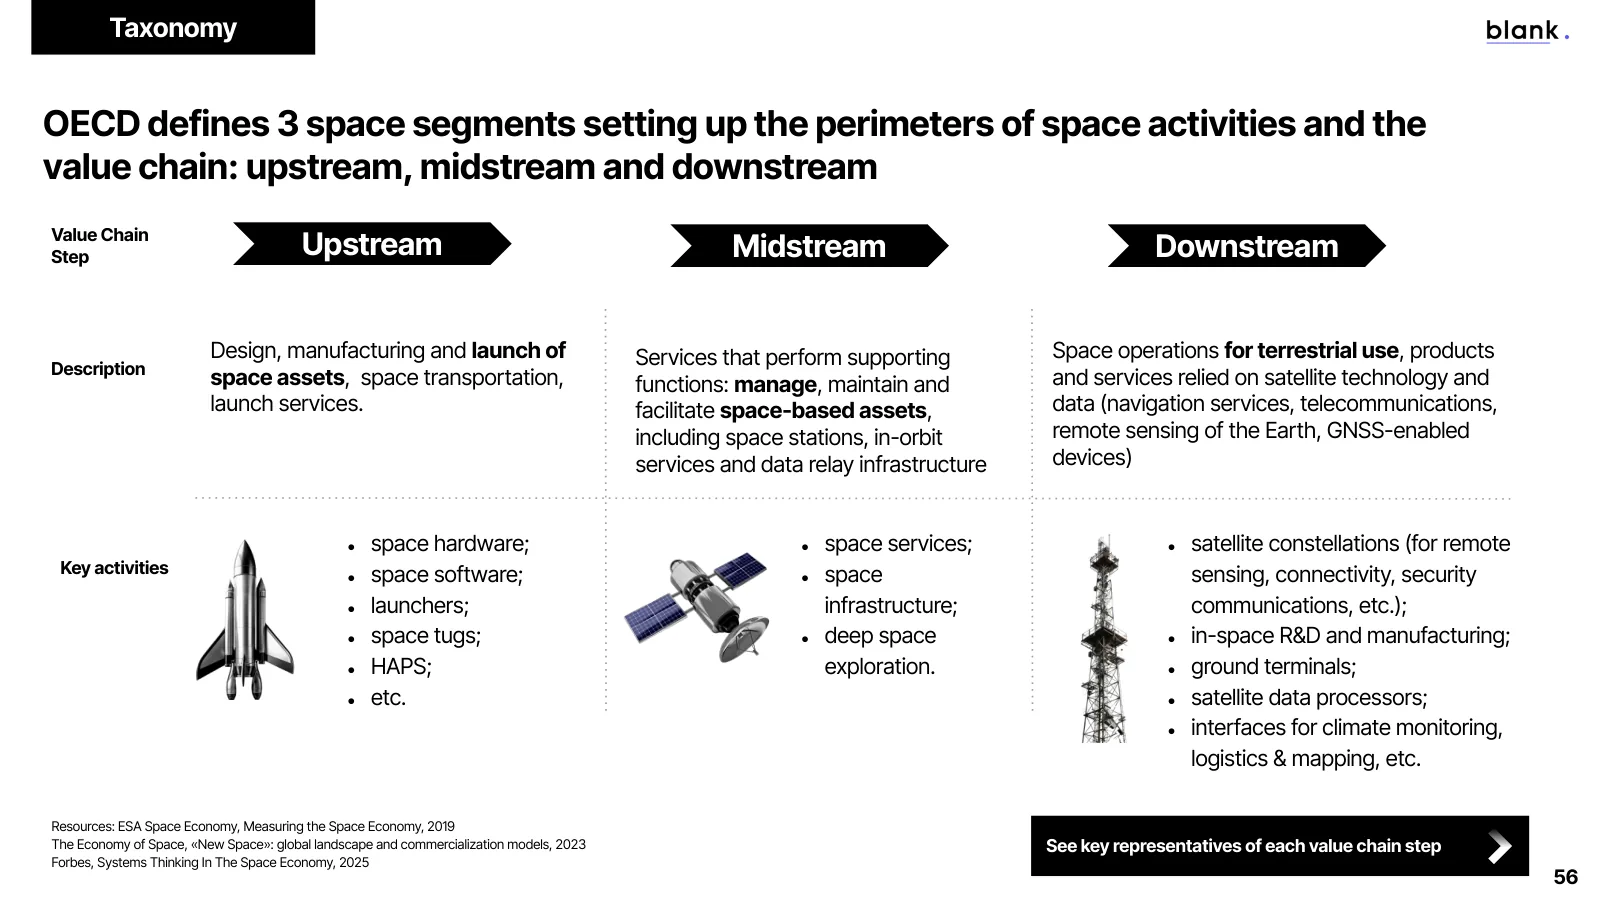
Slide: OECD value chain of the space economy, upstream, midstream, downstream07
Taxonomy. The OECD value chain: upstream, midstream and downstream, with the companies in each link.
Slide: hype curve of 39 space technologies08
Hype curve. 39 space technologies placed by maturity, following the Gartner methodology.

Three stories from the report.

54,000objects larger than 10 cm now circle the Earth

Orbital congestion is turning into a market

Around 54,000 objects larger than 10 cm and roughly 1.2 million larger than a centimeter now circle the Earth. Every new constellation adds defunct hardware, and the Kessler Syndrome, a cascade of collisions, is shifting from theory to operational risk.

The legal framework lags behind. Under the Outer Space Treaty and the Liability Convention a dead satellite remains the property of the launching state, so cleaning up someone else's debris can look like interfering with sovereign property. Regulators are starting to close the gap: ESA, for instance, cut the maximum disposal time in low Earth orbit from 25 to 5 years. This tightening is what turns orbital safety into a service market with recurring revenue.

The biggest constraints on SpaceTech growth today aren't technical; they are regulatory and policy-oriented.

Advisor to the fund, former Executive Director of the US Congressional Space Caucus
12 yrson average from first funding to acquisition

The long road to liquidity is finally paying off

Space companies still mature slowly: about 12 years on average from first funding to acquisition. In 2025 patience got rewarded. Firefly Aerospace, Karman Space & Defense and Voyager went public, and Voyager's shares opened more than 100% above the offer price on day one.

J.P. Morgan Chase launched its ten-year $1.5 trillion Security & Resiliency Initiative, including $10 billion in direct equity and venture investments, with aerospace and defense among the focus areas. The year's largest private rounds included Stoke Space ($410M Series D), Impulse Space ($300M), True Anomaly ($260M) and Varda Space Industries ($187M).

OpExhow NASA now pays for cargo and data in orbit

Governments have become customers of services

NASA's experience in low Earth orbit taught it that owning the hardware isn't necessary to deliver the mission. The agency pays for cargo delivery or data as an operating expense, while the commercial provider owns and runs the asset. One of the report's experts sees these long-term service contracts as the economic backbone of orbital logistics.

Sectors we covered.

To make the report useful both to industry insiders and to investors just starting to look at space, we built it on two frameworks.

/ 01

A twelve-segment taxonomy

Every company in the report sits in one of twelve segments, so a reader can find the part of the market they care about in a minute.

Satellites

  • Earth observation
  • Communications
  • Navigation
  • Manufacturing and components
  • Ground infrastructure

Space transportation

  • Small launchers
  • Heavy launchers
  • Reusable launchers
  • Rideshare
  • Orbital transfer vehicles

In-space operations

  • Refueling
  • Servicing
  • Debris removal
  • Collision avoidance
  • On-orbit assembly

Geospatial intelligence

Space exploration

Space medicine

Nuclear propulsion

Robotics

Semiconductors and materials for space

Crewed spaceflight

R&D in microgravity

Space-based solar power

/ 02

The OECD value chain

Upstream covers the design, manufacturing and launch of space assets. Midstream covers stations, in-orbit services and data relay. Downstream covers products and services built on satellite data for terrestrial markets.

For each link we selected three companies at different stages of maturity and traced how the capital they raised maps onto the growth of their product lines.

UpstreamMidstreamDownstream
MatureSpaceXAxiom SpaceICEYE
DevelopingK2 SpaceQuantum SpaceVarda Space Industries
ProminentStoke SpaceOrbit FabAirmo
Slide: OECD value chain with example companies in upstream, midstream and downstream

Looking ahead: 2026, 2030, 2035.

The report closes with a foresight built around three horizons.

Through2026

Activity stays centered on Earth orbit

  • Reusable launchers
  • Direct-to-device broadband
  • Life extension for GEO satellites
  • The first orbital data centers
By2030

A cislunar economy takes shape

  • Crewed Artemis missions
  • Commercial lunar landers
  • Fission power on the lunar surface
  • Private stations step in as the ISS retires
By2035

The agenda moves toward Mars

  • Nuclear propulsion
  • Asteroid prospecting
  • Recycling debris directly in orbit

To separate real markets from inflated expectations, we placed 39 space technologies on a hype curve following the Gartner methodology: from mature CubeSats and small launchers to orbital data centers, helium-3 extraction and the space elevator, with a plateau horizon of 15 years or more.

Slide: the hype curve of space technologies

Where the numbers come from.

/ 01

National space agency statistics

Data from ESA, NASA, JAXA and ISRO, US Air Force and NASA budget documents, and ISS National Laboratory materials gave us a reliable picture of government spending and programs.

/ 02

Venture databases

Tracxn, Crunchbase and CB Insights data on startups, funding rounds and investors underpinned the analysis of the investment landscape, the largest deals, and 2025 M&A and IPO activity.

/ 03

Industry reports and expert insight

Research from EY, Deloitte and PwC, industry analysts Novaspace and BryceTech, Seraphim's SpaceTech map, and publications by the Space Foundation and Secure World Foundation. Three experts commented on the findings: a former US congressional space policy advisor, a business development executive at a company in NASA's lunar delivery program, and the head of a global network of space entrepreneurs.

/ 04

Media and corporate sources

Coverage from Reuters, Forbes, CNBC, TechCrunch and other business media, along with company press releases, helped us track trends and events that had not yet made it into the statistics.

This website uses cookies to improve your web experience.
Explore
Drag